Which careers pay the most depends a lot on where you are. We took the largest job market on each continent and pulled the latest pay figures from each country's statistics office, tax office or biggest salary survey. Then we converted the tech salaries to US dollars to show how far the same career goes in each place.
The short version: medicine is the best-paid career in almost every country. Tech, finance, engineering and senior management come next. In rich countries the gap between top careers and average pay is about two to three times. In Brazil, China and South Africa, a tech career lifts you much further above the local average, which is why remote jobs paid from abroad are so attractive there.
New to the topic? Start with highest-paying careers explained, which covers why some careers pay more than others.
How we compared the markets
Each country measures pay its own way, so we used the best official or large-scale source for each and say exactly what it measures. Compare the rankings inside a country freely. Compare the amounts between countries with care.
| Continent | Market | Source | What it measures |
|---|---|---|---|
| North America | United States | Bureau of Labor Statistics (OEWS) | Median yearly wage by occupation, May 2025 |
| Europe | Germany | Stepstone Gehaltsreport 2026 | Median yearly salary by career field, full time, 2025 |
| Asia | China | National Bureau of Statistics | Average yearly wage by industry, 2025 |
| South America | Brazil | Novo CAGED and IBGE | Median monthly base salary of formal jobs, 2026 |
| Africa | South Africa | Statistics South Africa and Pnet | Average monthly earnings by industry, May 2026, and advertised salaries by role |
| Oceania | Australia | Australian Taxation Office | Average taxable income by occupation, 2023–24 |
Why South Africa for Africa? It is one of the continent's largest economies and its statistics office publishes detailed earnings figures every quarter. Other large African economies, such as Nigeria and Egypt, publish pay data less often and in less detail.
North America: United States
The US publishes pay for more than 800 occupations, so it gives the clearest picture of which careers pay most. Doctors lead by a wide margin. Behind them are pilots, executives, tech managers, dentists, finance managers and lawyers.
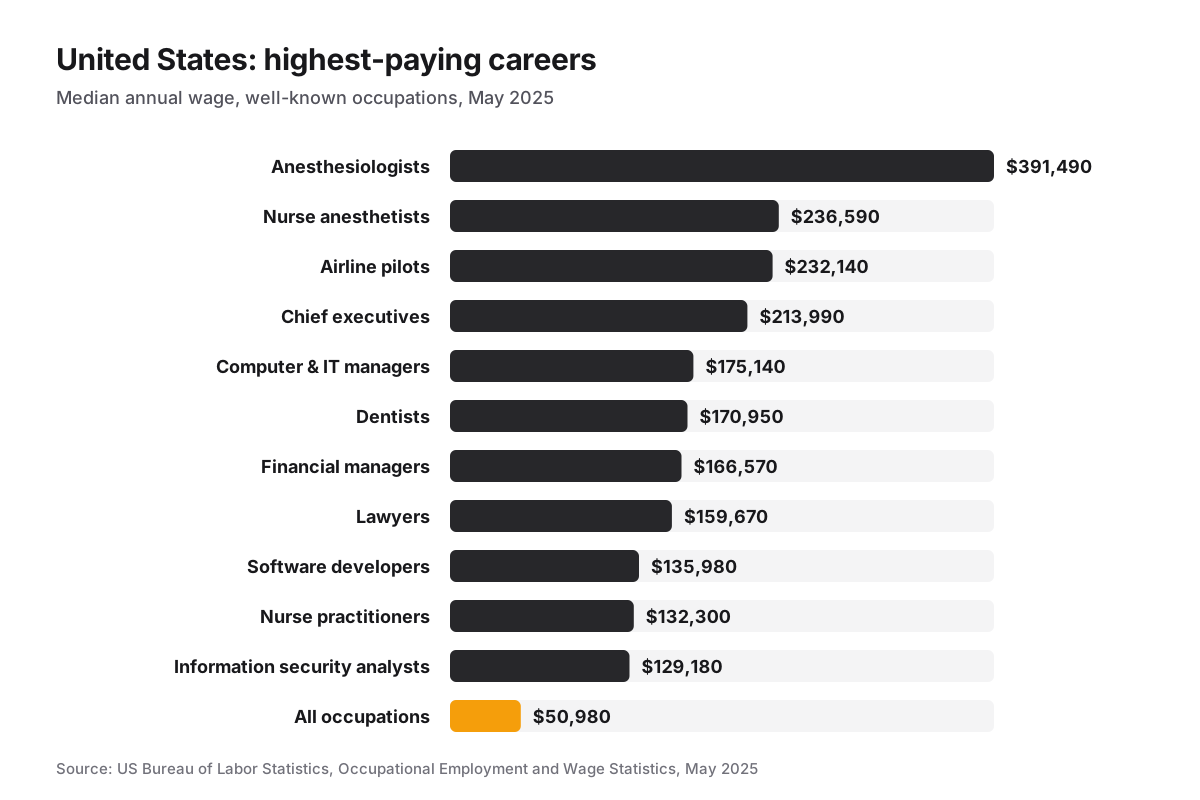
| Occupation | Median annual wage |
|---|---|
| Anesthesiologists | $391,490 |
| Nurse anesthetists | $236,590 |
| Airline pilots, copilots & flight engineers | $232,140 |
| Chief executives | $213,990 |
| Computer & information systems managers | $175,140 |
| Architectural & engineering managers | $171,270 |
| Dentists (general) | $170,950 |
| Financial managers | $166,570 |
| Lawyers | $159,670 |
| Petroleum engineers | $144,910 |
| Software developers | $135,980 |
| Nurse practitioners | $132,300 |
| Information security analysts | $129,180 |
| All occupations | $50,980 |
Source: BLS Occupational Employment and Wage Statistics, May 2025.
What stands out: software developers are the best-paid job with more than a million workers, at a median of $135,980. Nurse anesthetists show that you do not need to be a physician to earn a top-tier wage in healthcare.
Europe: Germany
Germany is Europe's largest economy. Its pay is more compressed than in the US: the best-paid field earns about 1.8 times the national average. In the US, the best-paid job earns more than seven times the median.
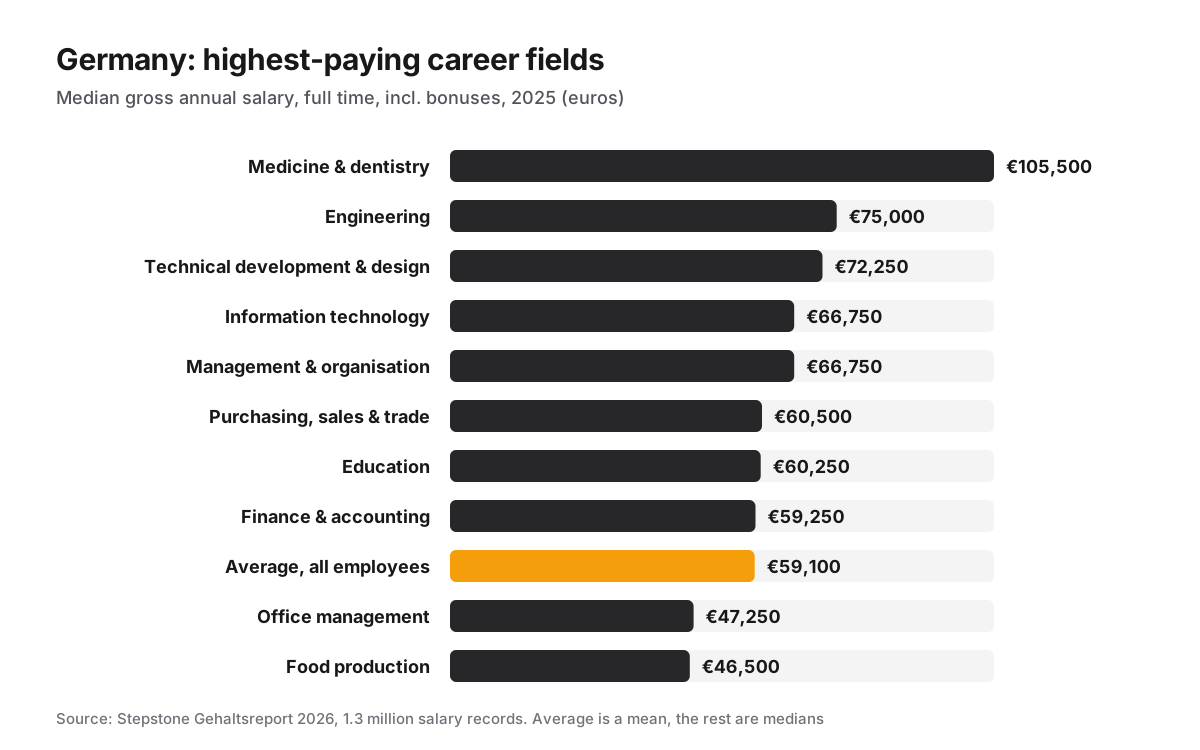
| Career field | Median gross salary per year |
|---|---|
| Medicine & dentistry | €105,500 |
| Engineering | €75,000 |
| Technical development & design | €72,250 |
| Information technology | €66,750 |
| Management & organisation | €66,750 |
| Purchasing, sales & trade | €60,500 |
| Education | €60,250 |
| Finance & accounting | €59,250 |
| Nursing, rescue & midwifery | €58,000 |
| Law & administration | €57,500 |
| Average, all employees | €59,100 |
| Office management | €47,250 |
| Food production | €46,500 |
Source: Stepstone Gehaltsreport 2026, 1,326,157 salary records from January 2022 to November 2025, full-time, including bonuses. The average is a mean; the field figures are medians.
- Leadership pays. Doctors who manage staff earn a median of €115,500, against €92,750 for those who do not.
- Engineering beats IT. Germany's strong manufacturing base means engineers out-earn IT workers, the reverse of the US.
- There is a gender gap. The median for men is €55,900 and for women €50,500.
Asia: China
China is Asia's largest economy. Its statistics office reports pay by industry, not by job title. Internet, software and IT services pay more than any other industry, ahead of finance.
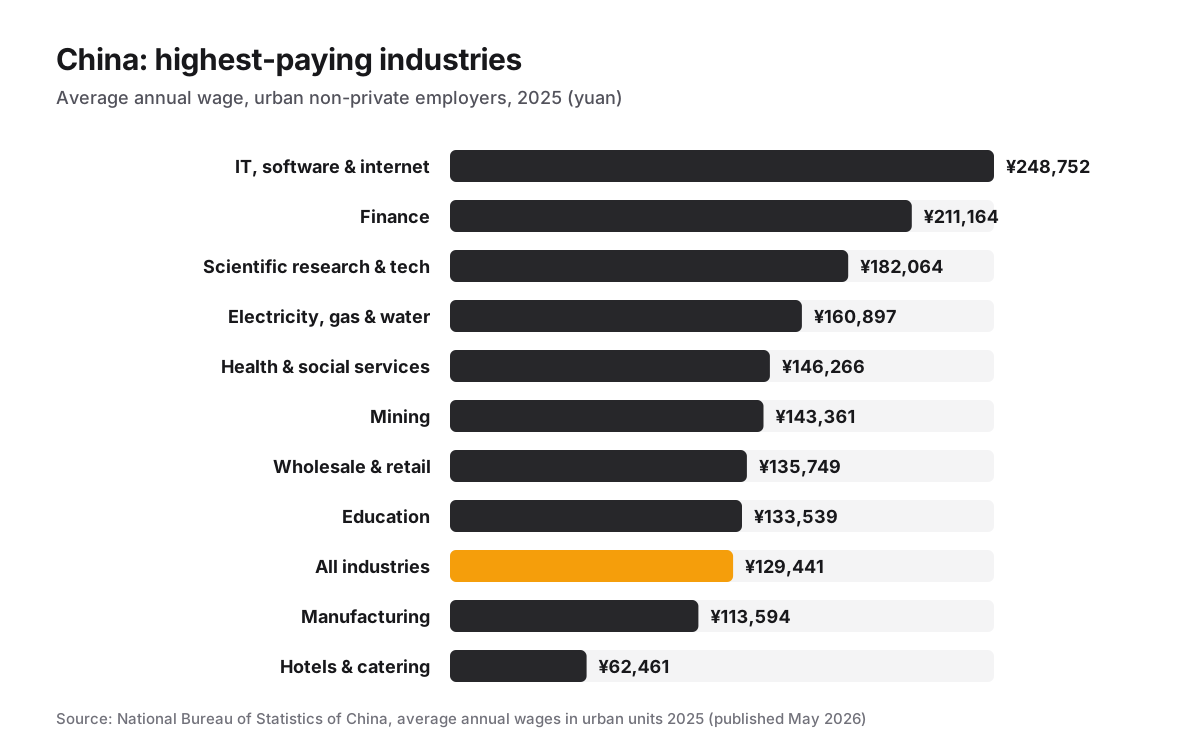
| Industry | State and large employers | Private employers |
|---|---|---|
| IT, software & internet | ¥248,752 | ¥128,166 |
| Finance | ¥211,164 | ¥140,451 |
| Scientific research & technical services | ¥182,064 | ¥83,560 |
| Electricity, gas & water | ¥160,897 | ¥66,451 |
| Health & social services | ¥146,266 | ¥75,631 |
| Mining | ¥143,361 | ¥79,169 |
| All industries | ¥129,441 | ¥71,590 |
| Hotels & catering | ¥62,461 | ¥55,123 |
Source: National Bureau of Statistics of China, average annual wages in urban units 2025, published May 2026. "State and large employers" are urban non-private units; private units are smaller private firms.
Within IT, the level you reach matters even more than the industry. At larger IT firms, middle and senior managers average ¥472,496 a year, professional and technical staff ¥275,504 and office staff ¥158,664.
Japan, Asia's other big high-wage market, shows the same pattern: managers earn ¥591,000 a month in scheduled pay, against ¥340,600 for all full-time workers (Ministry of Health, Labour and Welfare, 2025 wage survey; JIL summary).
South America: Brazil
Brazil is South America's largest economy. Its best-paid careers are senior roles in tech, sales and marketing, followed by doctors and engineers.
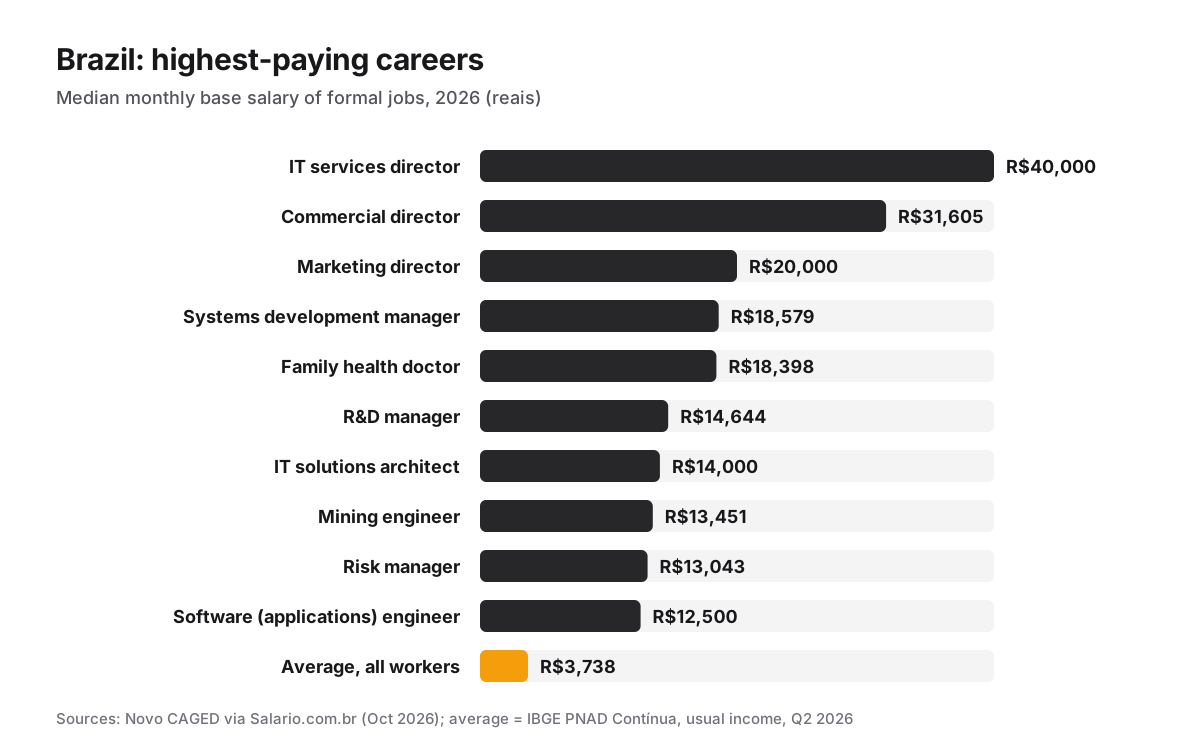
| Occupation | Median monthly base salary |
|---|---|
| IT services director | R$40,000 |
| Commercial director | R$31,605 |
| Marketing director | R$20,000 |
| Systems development manager | R$18,579 |
| Family health doctor | R$18,398 |
| R&D manager | R$14,644 |
| IT production manager | R$14,627 |
| IT solutions architect | R$14,000 |
| Mining engineer | R$13,451 |
| Risk manager | R$13,043 |
| Software (applications) engineer | R$12,500 |
| Average, all workers | R$3,738 |
Sources: Salario.com.br ranking of Novo CAGED data, October 2026, formal (CLT) jobs, base pay without bonuses; average from IBGE PNAD Contínua, usual income from all work, quarter to June 2026.
Formal workers in Brazil also get a 13th salary each December and a holiday bonus of a third of a month's pay, so yearly pay is a bit more than 12 times the monthly figure. Engineering of every kind is well represented: mining, automation, chemical, mechanical, production and electrical engineers all have medians above R$11,700.
Africa: South Africa
Statistics South Africa reports average earnings by industry every quarter. Utilities pay most, at about twice the national average.
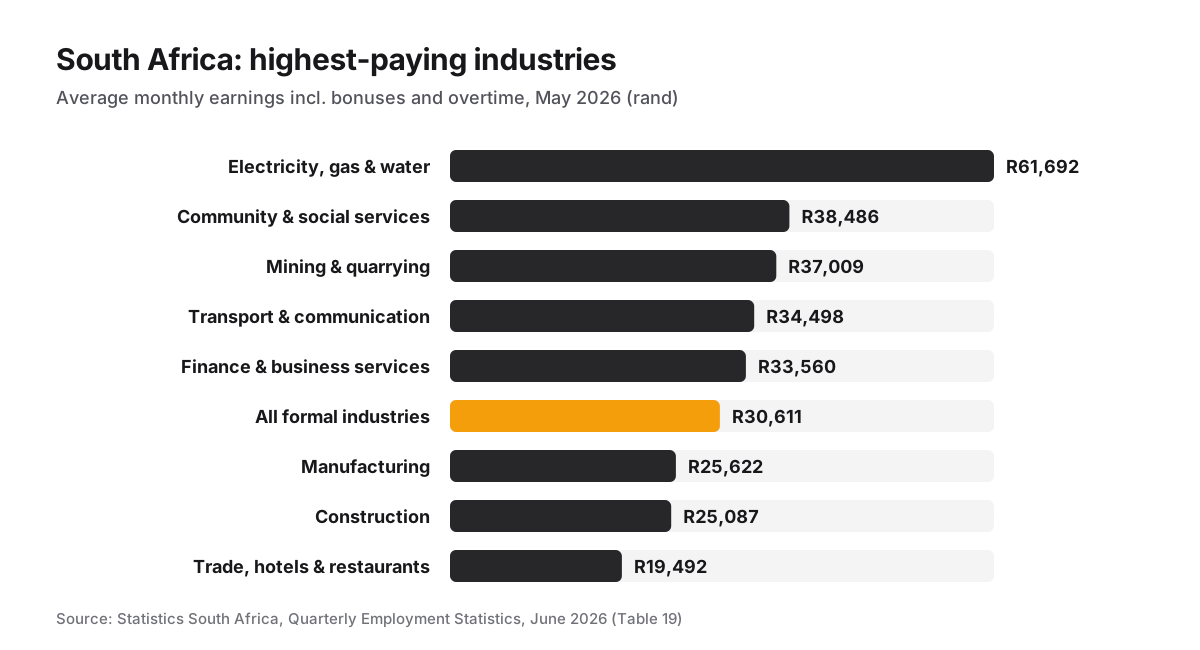
| Industry | Average monthly earnings |
|---|---|
| Electricity, gas & water | R61,692 |
| Community & social services | R38,486 |
| Mining & quarrying | R37,009 |
| Transport & communication | R34,498 |
| Finance & business services | R33,560 |
| All formal industries | R30,611 |
| Manufacturing | R25,622 |
| Construction | R25,087 |
| Trade, hotels & restaurants | R19,492 |
Source: Statistics South Africa, Quarterly Employment Statistics, June 2026, including bonuses and overtime, formal non-farm employers.
For individual roles, job board Pnet's 2026 salary guide shows what employers advertise. Executive and finance leadership is at the top, and tech roles pay well above the national average.
| Role | Advertised monthly pay (cost to company) |
|---|---|
| Chief executive officer | R144,482 – R225,000 |
| Chief financial officer | R118,333 – R254,615 |
| Executive manager, credit risk | R145,238 – R169,792 |
| Solutions architect | R41,667 – R52,500 |
| Data scientist | R36,667 – R50,000 |
| .NET, Java or C# developer | R36,000 – R50,000 |
| IT project manager | R31,000 – R50,000 |
Sources: Pnet 2026 Salary Guide, via IT-Online and TechCentral. Ranges come from job ads on Pnet over the previous 12 months.
Oceania: Australia
Australia's tax office publishes the average income of every occupation from tax returns. Surgeons have topped the list every year since it started.
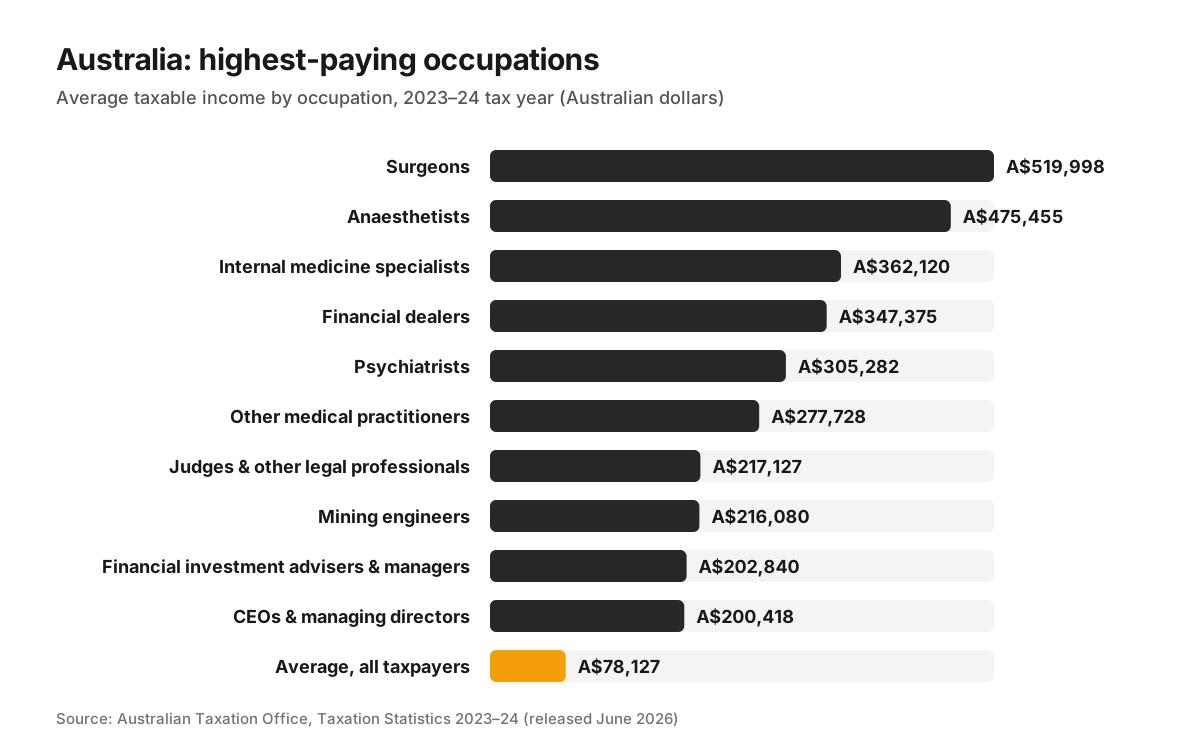
| Occupation | Average taxable income |
|---|---|
| Surgeons | A$519,998 |
| Anaesthetists | A$475,455 |
| Internal medicine specialists | A$362,120 |
| Financial dealers | A$347,375 |
| Psychiatrists | A$305,282 |
| Other medical practitioners | A$277,728 |
| Judges & other legal professionals | A$217,127 |
| Mining engineers | A$216,080 |
| Financial investment advisers & managers | A$202,840 |
| CEOs & managing directors | A$200,418 |
| Average, all taxpayers | A$78,127 |
Source: Australian Taxation Office, Taxation Statistics 2023–24, released June 2026; the top 10 as reported by Yahoo Finance. The median taxable income was A$58,739.
Six of the top ten are doctors. Mining engineers make the list too, reflecting the size of Australia's resources industry. Software engineers averaged about A$148,500 in the same data.
Same career, different pay: tech in US dollars
To compare across borders, we took one career that exists everywhere, software and IT, and set it beside each country's average or typical pay. Everything is yearly and converted to US dollars at market rates on 27 October 2026.
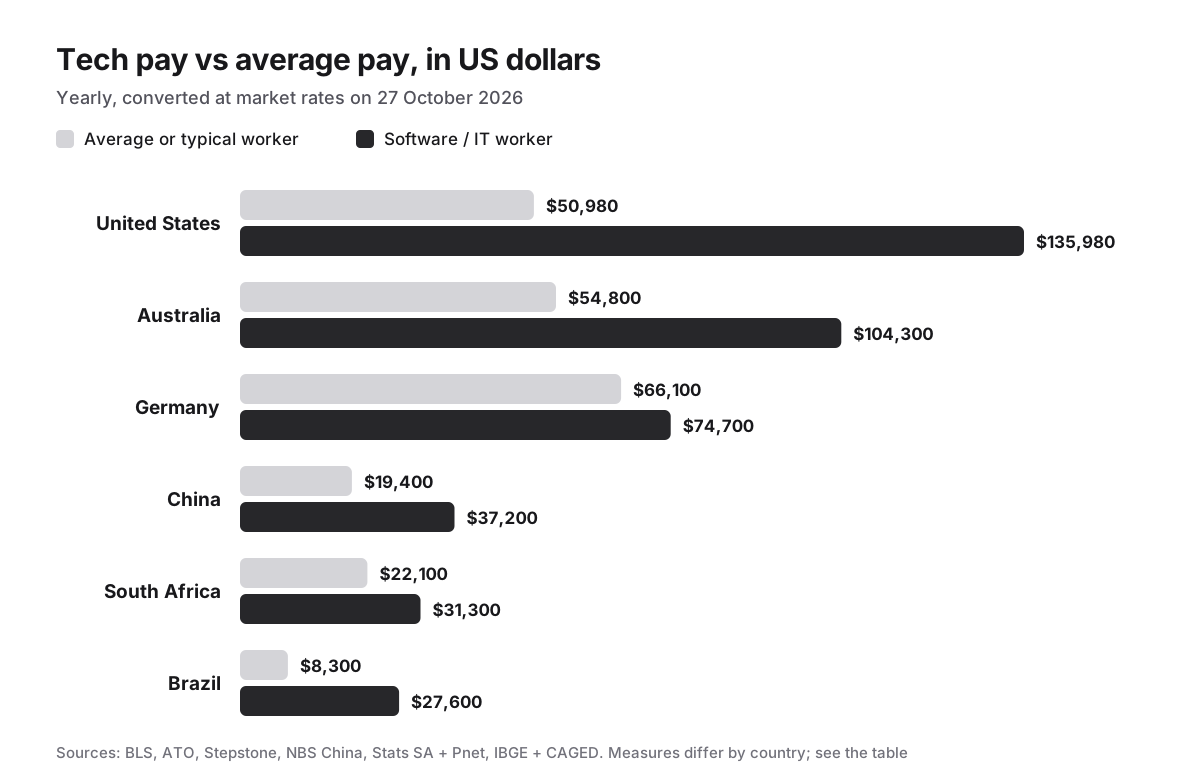
| Country | Average or typical pay | Software / IT pay | Tech multiple |
|---|---|---|---|
| United States | $50,980 (median, all jobs) | $135,980 (median, software developers) | 2.7× |
| Australia | $54,800 (average taxable income) | $104,300 (average, software engineers) | 1.9× |
| Germany | $66,100 (average, all employees) | $74,700 (median, IT field) | 1.1× |
| China | $19,400 (average, urban non-private) | $37,200 (average, IT industry) | 1.9× |
| South Africa | $22,100 (average formal earnings) | $31,300 (data scientist, midpoint of advertised range) | 1.4× |
| Brazil | $8,300 (average usual income) | $27,600 (median, software engineer) | 3.3× |
Exchange rates on 27 October 2026: 1 USD = 0.894 EUR, 1.42 AUD, 6.68 CNY, 16.64 ZAR and 5.43 BRL. Monthly figures are multiplied by 12. The measures differ by country, so read the multiple as a guide, not an exact figure.
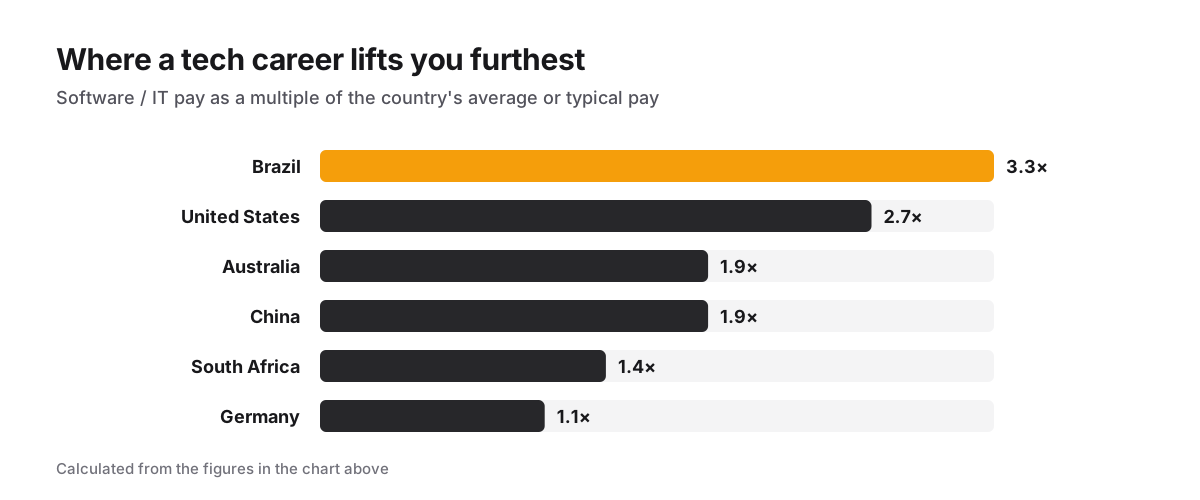
Two lessons come out of this:
- The richest markets still pay the most in dollars. A US software developer earns roughly five times a Brazilian one at market exchange rates, even though living costs are not five times higher.
- In emerging markets, a tech career lifts you furthest above local pay. In Brazil, a software engineer earns more than three times the average worker. Add a remote job paid in US dollars, and the jump can be bigger still.
What all six markets have in common
- Medicine pays the most wherever pay is reported by occupation: the US, Germany, Australia and, near the top, Brazil.
- Tech and finance come next. IT is the best-paid industry in China and near the top in every other market.
- Leadership multiplies pay. Directors in Brazil, managers in China and Japan, and executives in South Africa earn far more than the staff they lead.
- Engineering does best where industry is strong: Germany's factories, Australia's and Brazil's mines.
- Hospitality, retail and food production pay least in every market that reports them.
What this means if you work remotely
You cannot carry a surgeon's licence across borders, but you can carry skills in support, sales, data, IT and project management. These are the careers most often hired remotely, and an employer in a high-wage market pays in its own currency.
- See which fields hire the most remote workers in our Remote jobs report 2026.
- Work out what a US-dollar offer is worth at home with the salary calculator or the hourly-to-monthly salary guide.
- Find out why some remote jobs say "US only" and how to spot the ones open to you.
Sources
- US Bureau of Labor Statistics, Occupational Employment and Wages, May 2025
- Stepstone Gehaltsreport 2026
- National Bureau of Statistics of China, Average annual wages of employees in urban units in 2025
- Japan Ministry of Health, Labour and Welfare, 2025 Basic Survey on Wage Structure
- Salario.com.br, highest-paying professions in Brazil (Novo CAGED)
- IBGE, PNAD Contínua
- Statistics South Africa, Quarterly Employment Statistics, June 2026
- IT-Online, Pnet 2026 Salary Guide top roles
- TechCentral, Tech salaries in South Africa
- Australian Taxation Office, 2023–24 Taxation Statistics